Monday, January 23, 2006

18 day breakouts


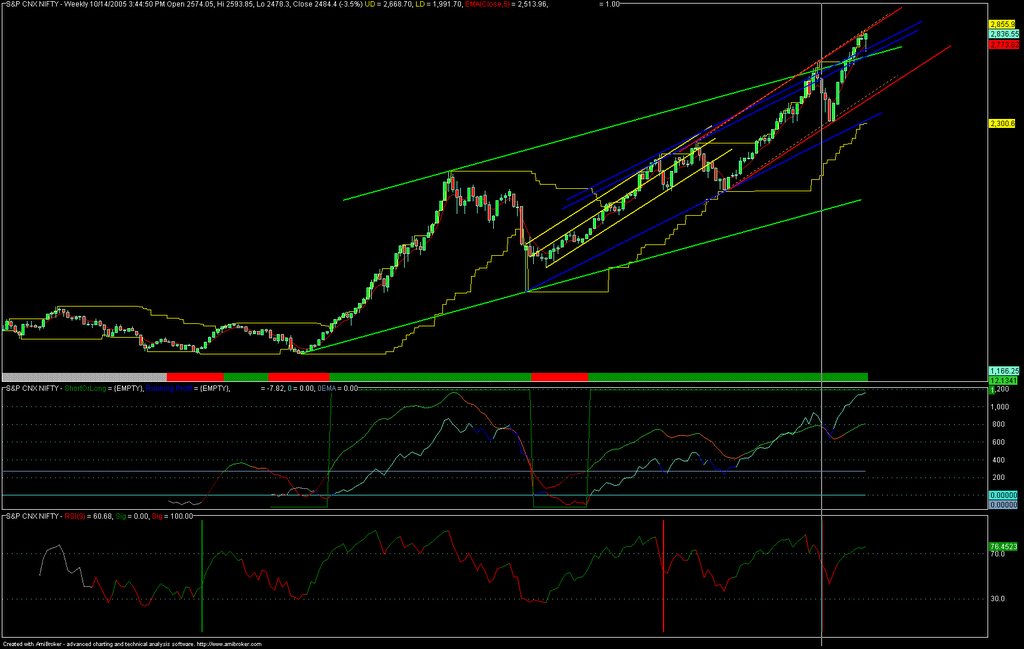
A picture is worth a thousand words.
I give you 2 pictures + a few words!!
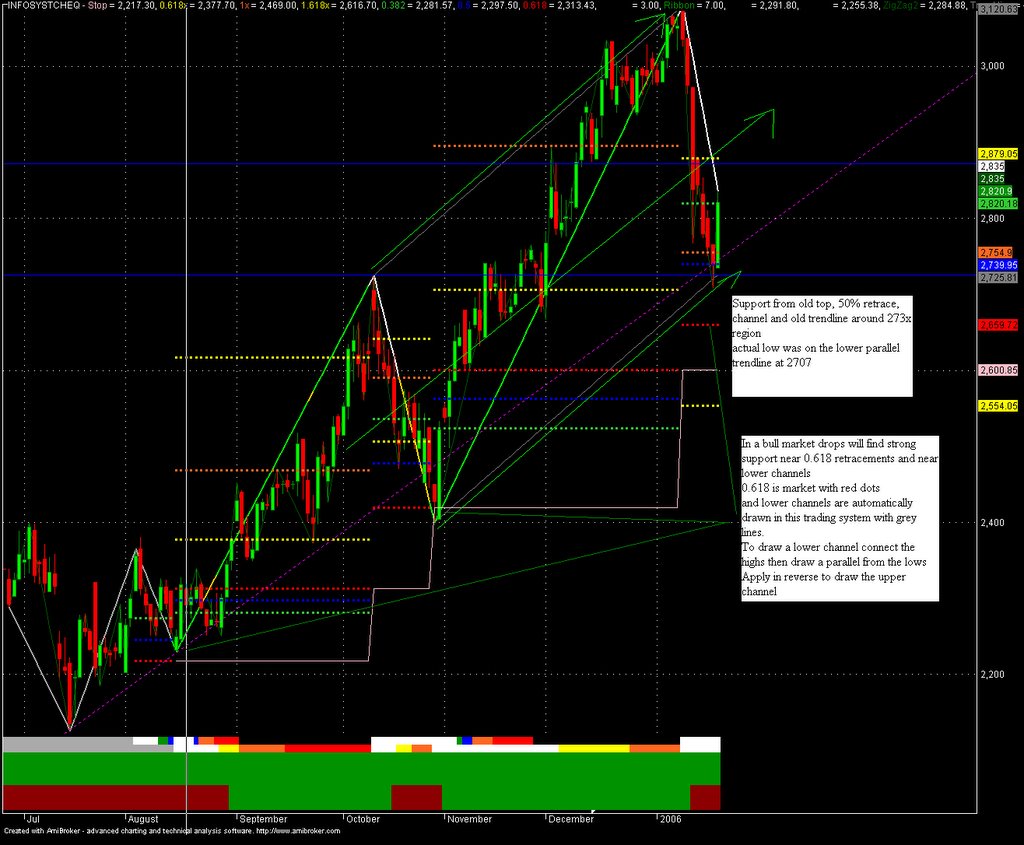
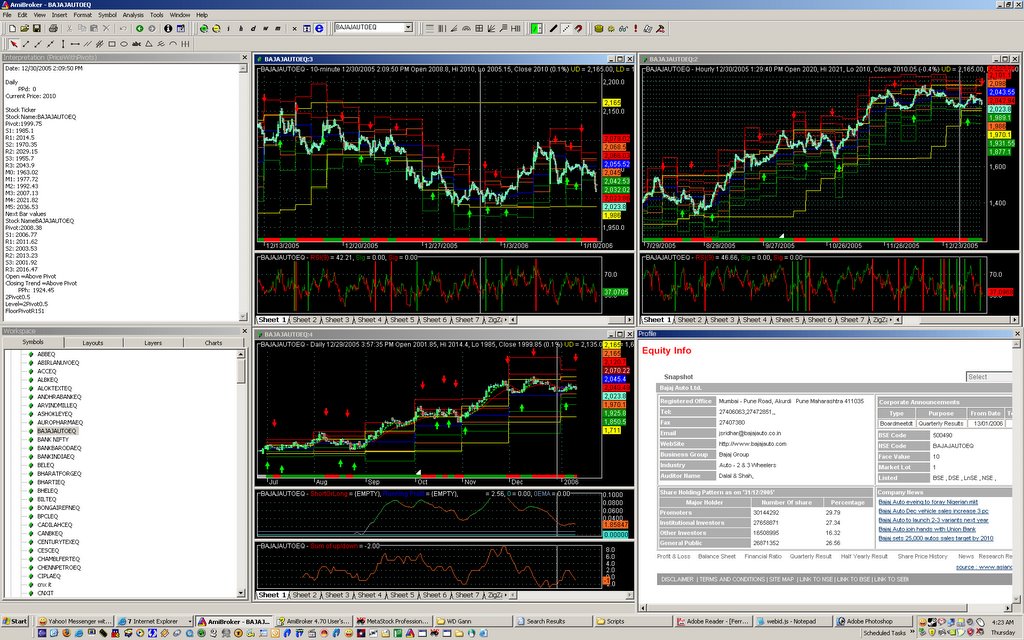
Quick summary, buy 18 day breakouts, pray for waveC/wave3. hedge using stocks below pivot if possible. this eliminates market risk from any sudden bad news.
Do not buy a breakout if it is already far above R1. R1-R2 is a reasonable intraday target on a breakout stock.
Pivot will rarely be seen in a breakout, you will only see old highs and minor dips below previous close. So don't wait for pivot! be aggressive , buy R1 the previous high or close above R1!!! book half at R2 :) and let the rest ride.
Stoploss will usually be below pivot level or below S1 depending on your timeframes.

Sunday, January 22, 2006

Relative str comp system tweaked with some ideas from larry williams


New system.
Using some ideas from larry williams's book
"THE SECRET OF SELECTING STOCKS FOR IMMEDIATE AND SUBSTANTIAL GAINS"
sorry caps too lazy edit
Basic idea: stock higher low index lower low= strong stock near a market bottom
if the market doesn't make the bottom then you will get into trouble.
Apply in reverse for shorts
I also added the williams ad line.
So this is his basic trading system.
Going to code automated divergence detection. But I can already sense that automated returns will be less than stellar.

Thursday, January 19, 2006

Infy channel holds, what comes next 3k+?


Lower channel holds
Upper channel next? or higher?
Forget ewt just follow the channel :)
w3 of w3 of w3 of III of iii
blah!!
Stoploss 2700
Amazingly enough Patil missed this channel
http://www.indiainfoline.com/trade/strategy.html
Mr. Patil was looking for at the shorter term channel and failed to do a direct comparison with the drop post results in october which was the logical place for similarity if any to be present.

Monday, January 16, 2006

Ema741revisited


If you like mechanical buy/sell signals
Then this is for you

Nifty uptrend/downtrend summary


Uptrend intact as long as 2800 area is held, targets 2870/2920/3062
Fresh downtrend intact as long as 2870 area is held , targets 2800,2760,2726,2640

Wednesday, January 11, 2006

Using amibroker's profile view for news/intradaydata


Add this line to setup your profile view in amibroker. This will keep you up to date with most of the important news regarding your stock
http://www.contentlinks.asiancerc.com/kotakstreet/CompanyProfileTicker.asp?Ticker={t}
To learn how to setup amibroker's profile view
a) Start amibroker
b) Hit F1
c) search for profile view

You can also use the following link in your profile view to get 5 day intraday data.
This can be useful when studying eod charts.
http://ichart.finance.yahoo.com/w?s={t}.NS
This link only works for some stocks for others a more complicated procedure is required.
You need to use the web id: {i} and put the correct yahoo name for your stock into webid.
The transformation is simple: Grab first 9 letters of nse ticker, thats your yahoo name.
Example INFOSYSTCHEQ But INFOSYSTC.NS
http://ichart.finance.yahoo.com/w?s={i}.NS
I'll post some the js file to configure webids and stuff later.

Tuesday, January 03, 2006

Follow the trend? or predict the trend?

The ultimate trend follower? Like an aimbot in q3 :) Not quite done yet.

Sunday, January 01, 2006