Monday, June 05, 2006

Free Nifty Trading system which outperforms buy and hold

This is one of the most rudimentary systems I have ever developed. I started with moving average systems last year. I currently use 7/105 on 10 mins.
The yahoo version is free!!!

So
Why 7/105? Because those are the values I got after running an optimization
Also usable are combinations in the region of 5-8/78-121.
I also use systems based on gann swing/ganntrend/ewt/multiple timeframe fibonacci for risk management (targets/stoplosses). If you want live nifty targets just ask me on yahoo. I am usually online during market hours and i'll usually have a target/stoploss in mind for nifty :). (yahooid=rajak1981)

Gist of the system.
1)If 70 min avg is above 1050 min avg play long, if 70 is below 1050 play short.
In pictoral terms: if green is above orange then long; if orange is above green then short.
2)try to use pullbacks to the green line the 70 min ema or the black line 210 ema to enter positions. (210 ema will result in smallest stoplosses under most circumstances, just look at the charts in an uptrend 210=great support and in a downtrend 210 = great resistance. 70ema can sometimes get whipsawed.)
3)Do not short if rsi is under 30
4)The stoploss is 0.8% to be employed as soon as you enter your trade.


Here is a summary
Statistics
All trades Long trades Short trades

Initial capital 500000.00 500000.00 500000.00

Ending capital 5157103.43 3750550.76 1906552.67

Net Profit 4657103.43 3250550.76 1406552.67

Net Profit % 931.42 % 650.11 % 281.31 %

Exposure % 96.90 % 64.87 % 32.03 %

Net Risk Adjusted Return % 961.19 % 1002.17 % 878.20 %

Annual Return % 938.05 % 654.27 % 282.72 %

Risk Adjusted Return % 968.03 % 1008.59 % 882.58 %

This is the performance over the last year.
Basically 938% returns on margin capital (20% margin)

Note: Also linking to full backtests from 2001-2006
with leverage 2001-2006 (annual return 663%,2845801.25 % net)


without leverage 2001-2006 (annual return 53.21%, net return 1223%)


The non leverage returns are most significant because they show that this silly system can return 53.21% per year without leverage under current market conditions
Ps: Doing buy and hold on nifty over the same duration would have resulted in a net return of only 240% or so. 1000-3400 = 240% roughly.

(I expect this system to stay profitable as long as we stay in this same cycle degree impulse. Which by my counts should be for ATLEAST another 2-3 years. Maybe another 10-20, depending on what your wave count is w3 of 3 into all degrees? or w5 somewhere :))


A lot of technicians these days post systems without specifying the profitability of the system. I think this is in bad taste. Someone posted a system using fib averages. The trailing stop employed by the system made sure that the only person getting rich would be the broker and not the trader. Another person posted a basic 12/26 macd system , 12/26 macd is not even profitable in 3,4,5 min timeframes. Even on 10 min timeframes it barely gives 446% per year.
Before I post a system I will make sure it is profitable and reasonably optimized. However I always suggest that people do their own testing before using a system. This will instill some confidence and allow the trader to use the system properly.
In most cases it is not the system that fails or stops working in a market. It is usually the trader who stops following the system after a series of losses. This usually happens right before a massively profitable trade is caught by the system.
Always remember that the most exciting moves will usually come out of boring sideways/consolidating markets.


Note:
If you want a detailed tutorial+afl on how to use this system/how to enter/use trailing stops to minimize entry/exit signals then it'll cost you 2500 Rs.

Friday, April 07, 2006

Resistance at upper channel of small swing+T3 of large swing 3556


Allrighty last post it was mentioned that even though we have divergence. the remote bullish possibility of 3556 should not be discarded. index faced resistance near 3080 as expected but bulls contained the damage to 3034. subsequently we have rallied at a ridiculous pace.
Currently we are getting resistance at upper channel of small swing + t3 of larger swing
next target is 3786
supports are 3430/3382/3311/3254
exactly where will the correction end?? only God knows

Position Traders can use the trailing buy stop technique to enter (last day's high is the entry trigger)
Intraday traders can try playing off of the floor levels.

Sunday, February 26, 2006

Will the Bears make a comeback?

Note: Pictures get screwed up by blogger so you can check out the original pic here:
http://f6.grp.yahoofs.com/v1/YLQBRLfALm1M6vMf65at7pnxoBLR5NzykJJKSFEeWO5-WpHXfuUom4Tih3MHnEGaTPIkG9KjYsrBDdFCDUqCNg/Raja's%20Nifty%20Analysis/niftymarch2006.PNG


We have broken all channels to the upside. We're living in the stratosphere.
The mega bulls would now be aiming for 3556!!!
At this juncture. I have a moderately bearish view.
I have recently switched to using pure fibonacci+channels without getting into the nitty gritty of wave counts.
The picture attatched in this post will explain my perspective.
Summary is:
Above 3063 bullish: Targets 3080/3100; max target 3556. A very remote possibility which should not be discarded.
My opinion is that bearishness will surface if we stay below 3080 and 3063.
Targets 2784/2640/2307.

Also a note for the mega bears who are calling this Wv of w5 of wV. There is no divergence on the monthly charts to confirm that hypothesis!! There is divergence on the weekly charts which suggests w5 of say WIII/WI. Some kind of correction is indeed likely. When we get divergence on the monthly charts then I would be comfortable calling a mega wV top.

Sunday, February 05, 2006

A Mathematician/Technician's Take on fundamentals and 'CANSLIM' (+links to help you apply 'CANSLIM')

All assets in the world are discounted by using the risk free interest rate. So it would be useful for investors to understand the dynamics of interest rates, growth rates, earnings yield, inflation and asset value.
Long story short: read the following link. I'll try to find a more lucid english wordy version for the mathematically challenged people later.
http://www.digitaleconomist.com/yld_4020.html
If you want to make money using investments this is the systematic way to do it. P.E/P.E.G/ROCE are shortcuts just like rsi, macd etc are shortcuts and
Price (OHLC)/volumes/OpenInterest/channels are the real deal.
Anyway I started to invest by studying fundamental values of stocks. I wanted to know what I was buying, why I was buying it, what it was worth? (translate npv of investment one year into the future) Why? Because I had taken a loan from my dad and promised to pay him the risk free interest rate after one year. This is how I started playing the market. I had a clear objective in mind when I started investing : BEAT Interest rates! Otherwise the difference would be coming out of my pocket!
I actually did a simple version of d.c.f by using estimates of profits from publicly available balance sheets and the buzz surrounding my stocks and their respective sectors. Last year I went mostly with tech , sugar, pharma and steel. In the May 2005 panick I picked up some banks as well.

I didn't do what typical investors do when buying shares. Thats because I was more of an arbitrageur than a true investor. My only goal was to have some money in my pocket at the end of one year (which by the way was accomplished fairly well since most of my investments last year did work out rather well). Can't say the same for this year. This year I've been moving around confused between Fundamentals and technicals :). My best pick last year was the technical+fundamental turnaround Dhampur sugar 45-170. Best picks this year were technical colgate 254-350, sterlite 1000-1300, abb 2070-2500. But then again this year ain't quite over yet :).
This year I like PHARMA and metals notice the caps in pharma :). Tech is ever green, its still in cycle degree wave III should be strong for atleast 5 more years. All dips to long term lower channels are to be bought in Tech. Just go talk to the management of these companies. They are growing all over the place.

http://www.physiciansnews.com/finance/1105.htmlhttp://www.bankrate.com/brm/news/fed/translation-jan06.asphttp://www.calculator.org/CalcHelp/finance.htm
This is to help you do the calculations. :)

By now people will be literally screaming for shortcuts. So I will give you one. Its called C.A.N.S.L.I.M.
Here's the original link where I picked this up from:
http://content.icicidirect.com/ULFiles/UploadFile_20039231273.asp?icicicode=type%20symbol
Personally I think the idea is good.
I didn't necessarily use the 'mantra canslim' but I was going through these same steps when I first entered the market. Somewhere along the way I got dissatisfied when I saw my great funda pick Rolta got stuck between 80-90 even as the market was going up 20-30%. I think thats when I started getting seriously into technicals.
Right now Rolta is well above 200 and in hindsight it did outperform the market as was expected from a fundamental standpoint. Without making any big excuses I got out way too early :). I need to work on a little bit more discipline.
So what is this Canslim? If you want my understanding of it read on; otherwise scroll up and click the icicidirect link!! I would reccomend doing both.
CANSLIM:
C=Current Earnings/Growth
A=Annual Earnings/Growth
N=New (New highs/New management/New deals/new products. but I just use the word news. Whats the buzz surrounding the stock good buzz? good vibes? or bad buzz)
(Usually looking at the weekly chart of a good stock will make you think , damn why didn't I buy this last week! Daily can have more noise and might look confusing, intraday is often a downright mess!)
S=Supply (supply of the the stock outstanding shares)
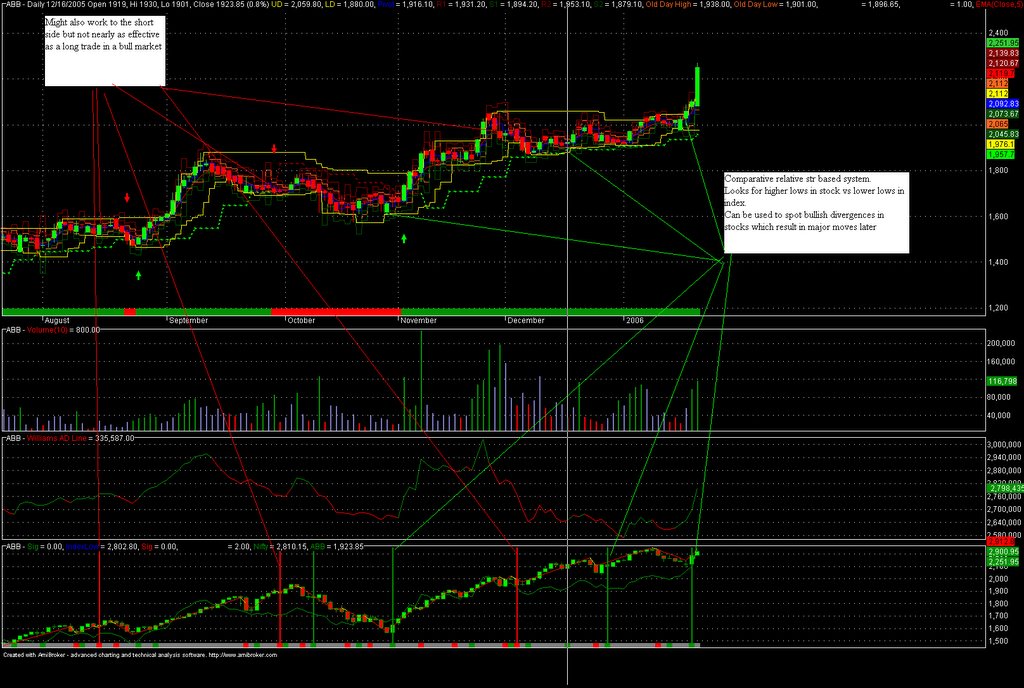
L=Leader (ranking among peers.)
I=Institutional (are the funds buying or selling??)
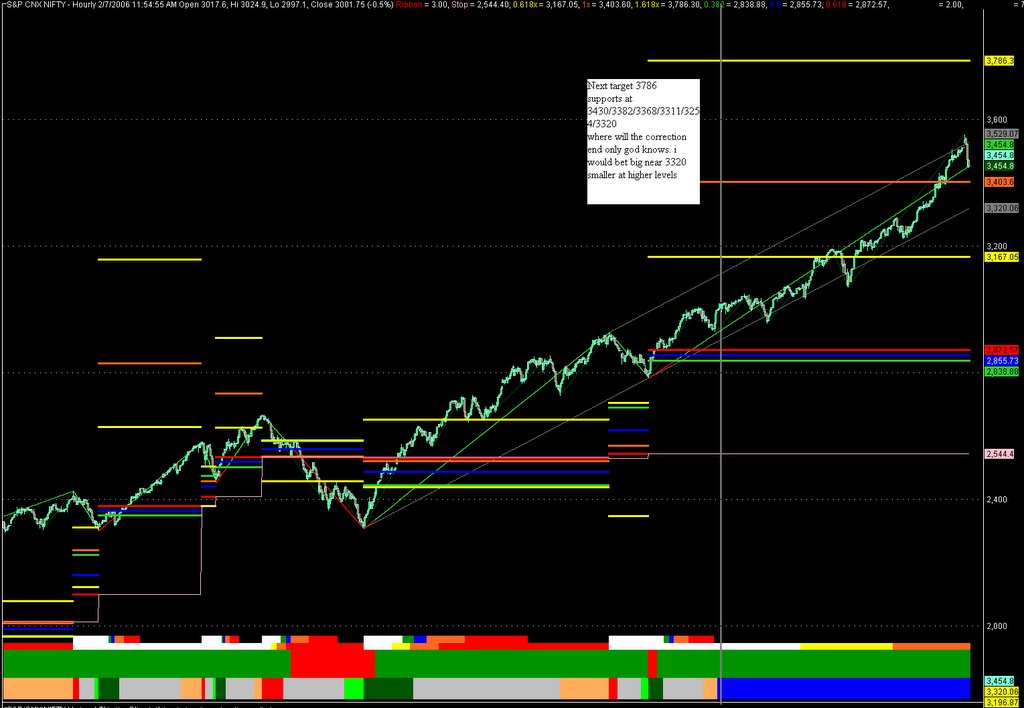
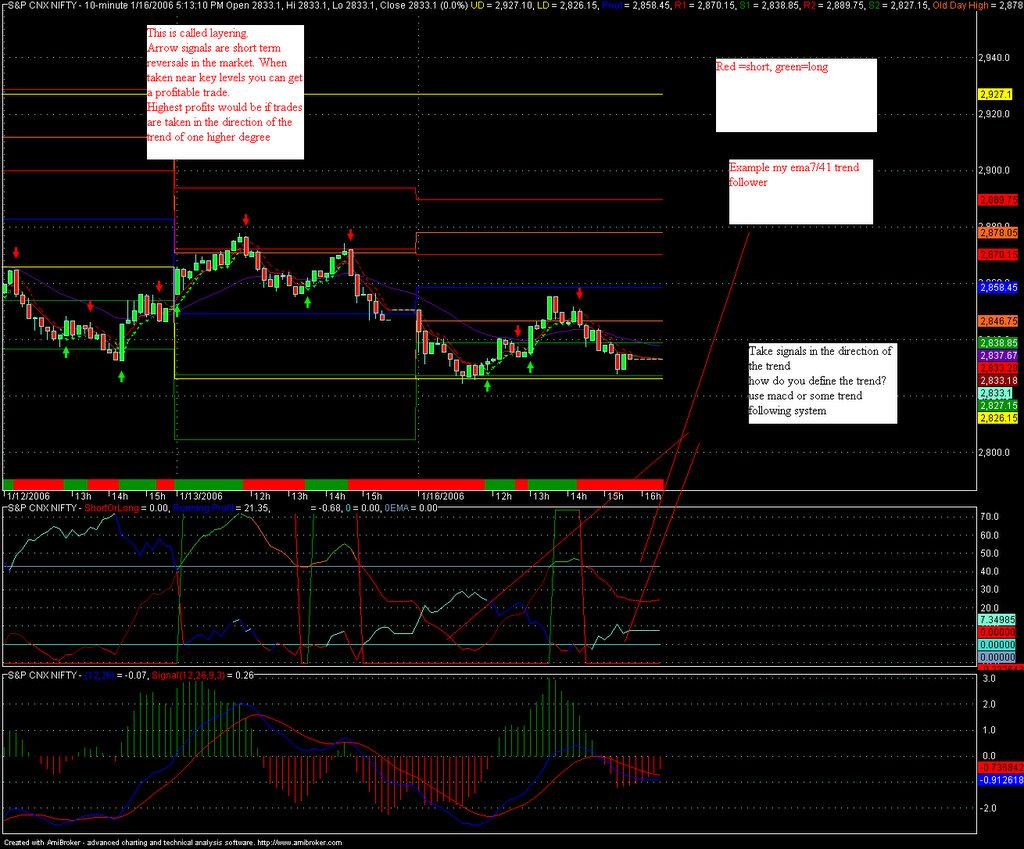
M= Market (TRADE IN THE DIRECTION OF THE MARKET quite important.
Can be as simple as using a weekly bar chart. Higher highs+Higher lows+Higher closes on the bars=uptrend. Lower lows+Lower highs+Lower closes on the weekly bar chart=downtrend and well flat is flat.)
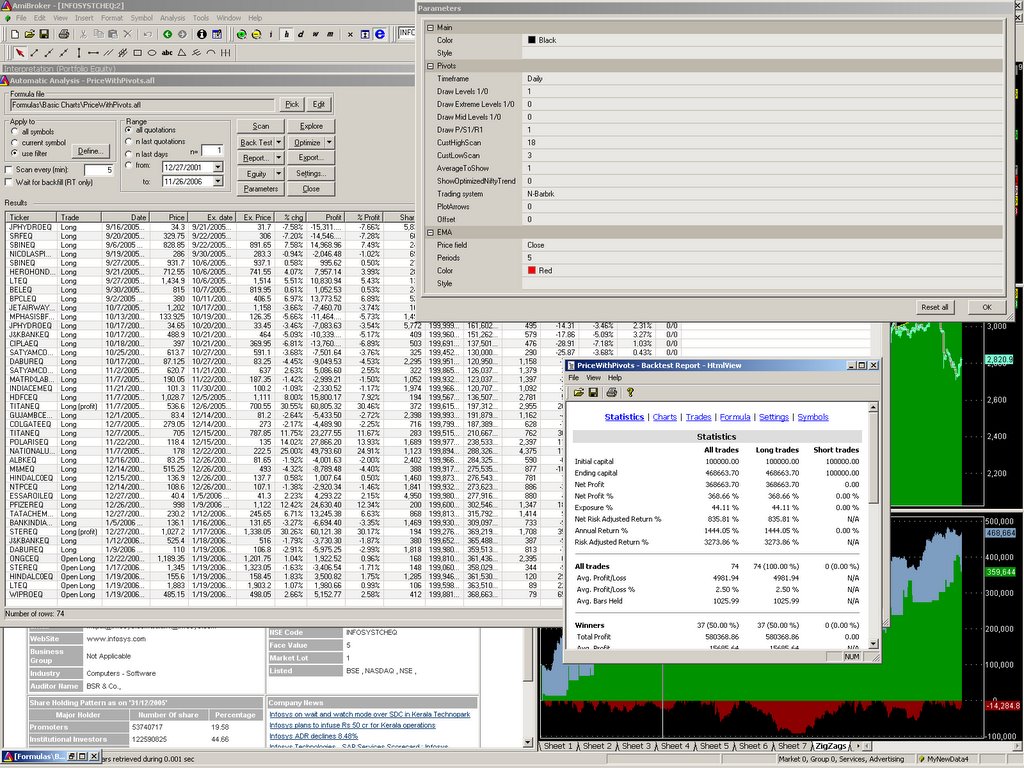
If you're really lazy you can check my yahoo group link on the left and download an afl which will keep you on the right side of the trend for the most part.

The info required for applying CANSLIM can be obtained using the following resources
Asiancerc has earnings, news and institutional holdings; almost all the stuff you will need.
http://www.contentlinks.asiancerc.com/kotakstreet/Corporate.asp
http://www.contentlinks.asiancerc.com/kotaknew/fundamental/Corporate.asp
You can either use your own stock database/my afl scripts to run scans or
you can check for new 52 week highs/lows at:
http://markets.moneycontrol.com/stocks/marketstats/bsehigh/index.php
http://markets.moneycontrol.com/stocks/marketstats/bselow/index.php

You can find stocks which supply/demand imbalances as well (this isn't exactly what the S in canslim means I'm just extrapolating a bit):
http://markets.moneycontrol.com/stocks/marketstats/onlybuyers.php
http://markets.moneycontrol.com/stocks/marketstats/onlysellers.php

In addition check out the following links to help you figure out bulkdeals; in particular mf bulkdeals. http://www.nseindia.com/content/equities/eq_bulkdeals.htm
http://mutualfunds.moneycontrol.com/mf/blockdeals/index.phpsel_month=200602
http://markets.moneycontrol.com/stocks/marketstats/blockdeals/nse/index.php
It is possible to actually check what the funds have been doing historically on a per stock basis at Moneycontrol. Only caveat is that this info is 1 month old . This particular link is for infosys just search for something else as required.
http://markets.moneycontrol.com/mf/user_scheme/mfholddetail_sec.php?sc_did=IT
(Remember for every buyer there is a seller. Who was the smarter party? :) . CANSLIM assumes that institutions are the smarter party. I don't know if they are necessarily smarter but they do employ more analysts and they do have the power to move the market so in most cases you don't want to be on their wrong side. Minor contrarian point here: if some big guy is ditching a stock then a stock may give a dramatic bounce after the selling pressure is lifted. )

So whats left? well you just need to figure out which way the market is going. For that check out all the resources mentioned on the left hand side of this blog. Including my technical analysis frameworks.

Research has shown a positive case for closing your eyes+blind funda/value investing. Just as my research has shown a positive case for certain mechanical signals in a bull market for short term traders :).
There are lots and lots of ideas out there in this world. The problem in most cases is that people seek to divide the world into two halves quite often. My problem is that I'm always looking for problems to solve :). Let me give you an anology. A man and a woman are 'opposites' when they come together you get a human child (if all goes well :D)
The same kind of synergy is present when opposite ideas meet. You just need to let them settle in your mind !

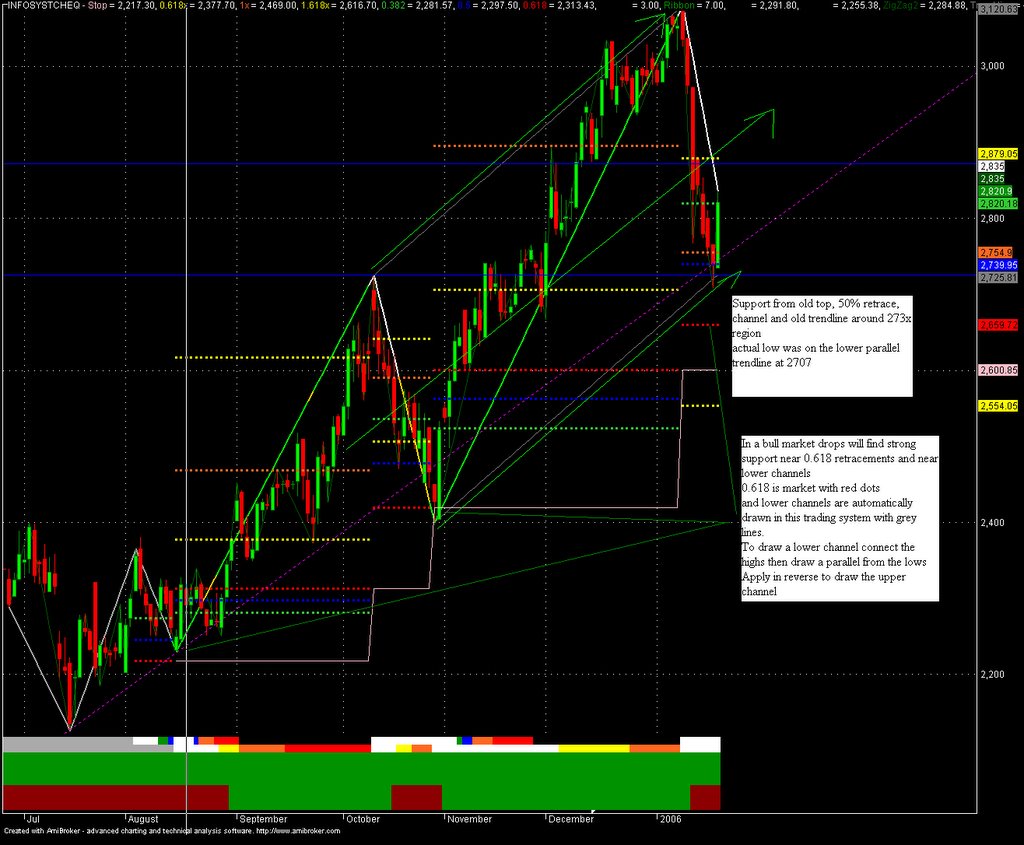
Hence final summary: Open your mind to the other side :). We're technicians , we buy breakouts and old lows, fib supports, channel supports and what not. But also consider buying into good fundamentals (or better still buy a good funda stock when it gives the breakout!!) .

Take some of the money you make from technical trading and invest it in funda stocks
You might be able to get in a few weeks/months/years earlier than the big big parabolic move breakout. When in 10 years the stock has appreciated 10000% you can thank me for having given you this idea!

Monday, January 23, 2006

18 day breakouts


A picture is worth a thousand words.
I give you 2 pictures + a few words!!
Quick summary, buy 18 day breakouts, pray for waveC/wave3. hedge using stocks below pivot if possible. this eliminates market risk from any sudden bad news.
Do not buy a breakout if it is already far above R1. R1-R2 is a reasonable intraday target on a breakout stock.
Pivot will rarely be seen in a breakout, you will only see old highs and minor dips below previous close. So don't wait for pivot! be aggressive , buy R1 the previous high or close above R1!!! book half at R2 :) and let the rest ride.
Stoploss will usually be below pivot level or below S1 depending on your timeframes.

Sunday, January 22, 2006

Relative str comp system tweaked with some ideas from larry williams


New system.
Using some ideas from larry williams's book
"THE SECRET OF SELECTING STOCKS FOR IMMEDIATE AND SUBSTANTIAL GAINS"
sorry caps too lazy edit
Basic idea: stock higher low index lower low= strong stock near a market bottom
if the market doesn't make the bottom then you will get into trouble.
Apply in reverse for shorts
I also added the williams ad line.
So this is his basic trading system.
Going to code automated divergence detection. But I can already sense that automated returns will be less than stellar.

Thursday, January 19, 2006

Infy channel holds, what comes next 3k+?


Lower channel holds
Upper channel next? or higher?
Forget ewt just follow the channel :)
w3 of w3 of w3 of III of iii
blah!!
Stoploss 2700
Amazingly enough Patil missed this channel
http://www.indiainfoline.com/trade/strategy.html
Mr. Patil was looking for at the shorter term channel and failed to do a direct comparison with the drop post results in october which was the logical place for similarity if any to be present.

Monday, January 16, 2006

Ema741revisited


If you like mechanical buy/sell signals
Then this is for you

Nifty uptrend/downtrend summary


Uptrend intact as long as 2800 area is held, targets 2870/2920/3062
Fresh downtrend intact as long as 2870 area is held , targets 2800,2760,2726,2640

Wednesday, January 11, 2006

Using amibroker's profile view for news/intradaydata


Add this line to setup your profile view in amibroker. This will keep you up to date with most of the important news regarding your stock
http://www.contentlinks.asiancerc.com/kotakstreet/CompanyProfileTicker.asp?Ticker={t}
To learn how to setup amibroker's profile view
a) Start amibroker
b) Hit F1
c) search for profile view

You can also use the following link in your profile view to get 5 day intraday data.
This can be useful when studying eod charts.
http://ichart.finance.yahoo.com/w?s={t}.NS
This link only works for some stocks for others a more complicated procedure is required.
You need to use the web id: {i} and put the correct yahoo name for your stock into webid.
The transformation is simple: Grab first 9 letters of nse ticker, thats your yahoo name.
Example INFOSYSTCHEQ But INFOSYSTC.NS
http://ichart.finance.yahoo.com/w?s={i}.NS
I'll post some the js file to configure webids and stuff later.

Tuesday, January 03, 2006

Follow the trend? or predict the trend?

The ultimate trend follower? Like an aimbot in q3 :) Not quite done yet.

Sunday, January 01, 2006